|
What type of sustainable technology should you use in your home? The 3 charts below help you answer that question based on each technology's return on investment and the age of your home.
(Click on each chart for a larger image.)
Chart 1: Return on Investment
Chart 2: Existing Home
Chart 3: New Home
|
Return on Investment
|
 |
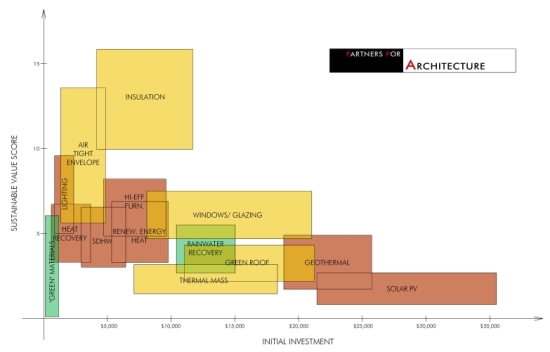
| This diagram shows how a value derived from the sustainability potential combined with the return on investment relates to the initial investment required to implement each technology. Technologies underplayed in yellow are related to the envelope of a building, technologies underplayed in red are related to energy generation and use, and those underplayed in green are related to sustainability. The categories that are closest to the top left of the chart represent the best sustainable value for the least initial investment. |
|
Existing Home
|
 |
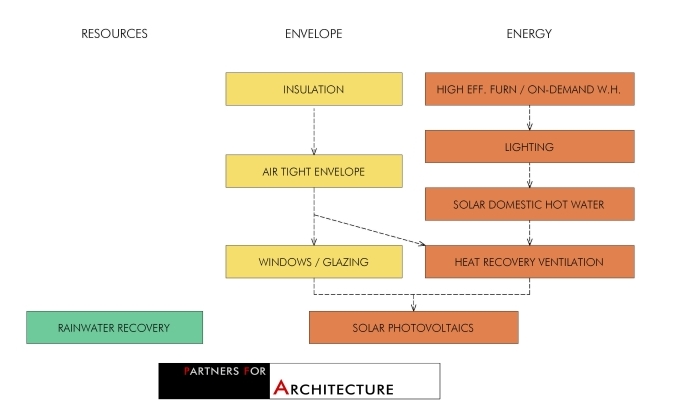
| This diagram displays a hierarchy of sustainable technologies based on the order in which improvements should be considered. The categories at the top of the chart represent items that are relatively easy to retrofit into an existing home and provide the best “bang for the buck.” The chart should be followed in the order as shown to make these investments work to their best potential. Keep in mind that these decisions obviously depend on pre-existing conditions in the house. |
|
New Home
|
 |
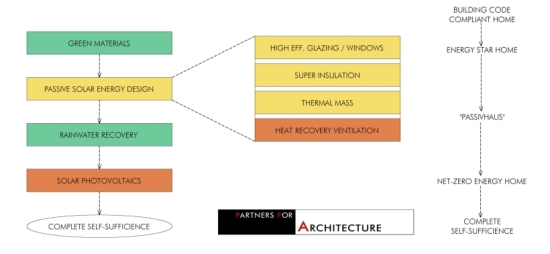
| This diagram shows different levels of sustainability for new home construction, and the related technologies involved. A net-zero energy home generates as much energy as it uses, but could use the electric grid to net-meter electricity. A completely self sufficient home does not rely on connection to any man made energy source. It is important to note that the first step to achieving a sustainable home is proper quality control during construction, in order to assure that minimum code requirements are actually implemented in the field. |
Charts provided by Partners for Architecture, Inc., Stamford, CT. |